

How to Turn Company Objectives Into Weekly Leading Indicators
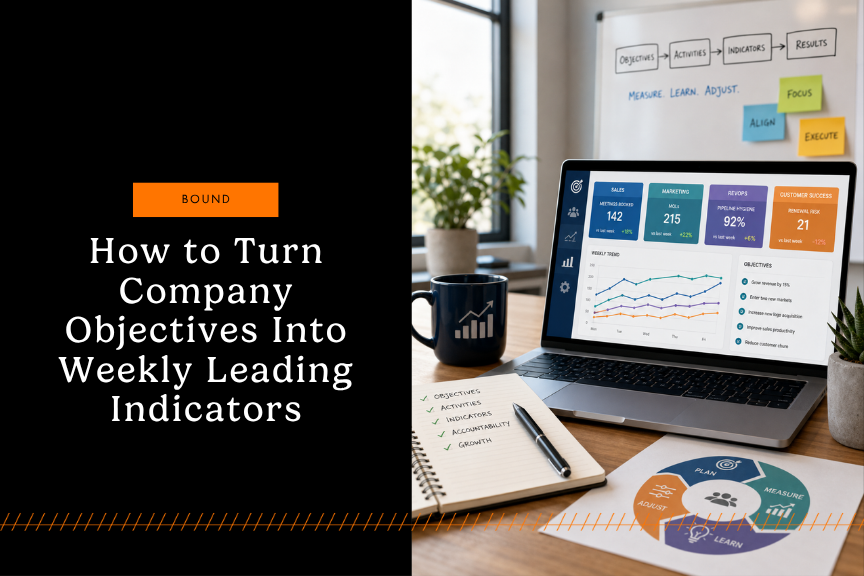
The Problem: Great Ideas, Weak Goals, No Measurement
Most companies measure what's easy to count: revenue, margin, closed deals, booked meetings. These are outcomes; the final results of work already completed. By the time you see them, it's too late to change course.
Leadership teams need a different set of metrics. They need leading indicators that reveal whether the team is doing the right work early enough to adjust strategy and pivot when needed. The difference between tracking outcomes and leading indicators is the difference between looking in a rearview mirror and watching the road ahead.
Why Leading Indicators Matter
Outcomes tell you what happened. Leading indicators tell you what's about to happen.
If your sales team closes 10 deals this month, that's an outcome. But the activities that led to those deals (calls made, meetings held, proposals sent) are leading indicators. They’re top KPI’s that predict whether next month's outcome will be better or worse.
The same principle applies across every department. Marketing's form submissions predict future sales pipeline. RevOps' data quality scores predict forecast accuracy. Customer success's renewal risk flags predict churn.
When you track leading indicators weekly, you get early warning signals. You can see bottlenecks forming before they become crises. You can identify which teams, markets, or campaigns need adjustment before quarterly reviews arrive.
Step 1: Start With Company Objectives
Begin by defining what your company actually needs to achieve. These should be specific, measurable, and tied to business outcomes. Common examples include:
-
Grow revenue by 15%
-
Enter two new markets
-
Increase new logo acquisition
-
Improve sales team productivity
-
Reduce customer churn
-
Improve quote-to-close conversion
Make sure to write these down in a place that’s visible to everyone who has a hand in making it happen. And remember to be specific about the target and timeline. Vague objectives like "grow revenue" don't work, but "Grow revenue by 15% in the next 12 months" does.
Step 2: Translate Objectives Into Controllable Activities
Here's where most companies get stuck. They set a revenue goal but don't break down what activities actually drive that goal.
Revenue growth, for example, depends on multiple factors working together:
-
Target account quality
-
Prospecting activity
-
Contact rate
-
Meetings booked
-
Meeting held rate
-
Opportunity creation
-
Proposal volume
-
Close rate
-
Average deal size
-
Sales cycle length
Each of these is something your team can influence. Each is a lever you can pull. When you map objectives to these controllable activities, you create a roadmap for execution.
The key is identifying which activities your team controls and which ones they don't. Your sales team controls how many calls they make. They don't control whether a prospect answers. They control whether they log activity in Salesforce. They don't control whether that activity converts.
Step 3: Build Leading Indicators by Department
Different departments drive different outcomes. Each needs its own set of leading indicators.
Sales Leading Indicators
-
New target accounts added
-
Calls and emails completed
-
Connect rate
-
Qualified conversations
-
Meetings booked
-
Meetings held
-
New opportunities created
-
Proposals sent
-
Follow-up tasks completed on time
Marketing Leading Indicators
-
Website conversion rate
-
Form submissions
-
Content engagement
-
Campaign-sourced leads
-
MQL to SQL conversion
-
Target account engagement
-
Paid campaign cost per qualified lead
CRM and RevOps Leading Indicators
-
Percent of accounts with complete firmographic data
-
Percent of contacts with verified email and phone
-
Opportunity stage aging
-
Lead response time
-
Pipeline hygiene score
-
Forecast category accuracy
-
Duplicate record rate
Customer Growth Leading Indicators
-
Customer touchpoints completed
-
Renewal risk accounts flagged
-
Expansion opportunities identified
-
Customer satisfaction trends
-
Cross-sell conversations started
These metrics should be tracked weekly. Weekly tracking creates urgency and accountability. Monthly reviews are too slow. Quarterly reviews are useless for course correction.
Step 4: Create Weekly, Monthly, Quarterly, and Annual Views
Leading indicators work best when you layer them across different time horizons. Each view answers a different question.
Weekly Scorecard
-
The weekly view is tactical. It answers: Are the inputs happening?
-
Are reps executing?
-
Are campaigns producing?
-
Are leads being worked?
-
Are opportunities moving?
This is where you catch problems early. If your team isn't making calls this week, you'll see it immediately. You can address it before it compounds into a missed quarter.
Monthly Review
The monthly view is operational. It answers: Are leading indicators converting into pipeline sales and growing account retention?
-
Which teams, markets, or campaigns need adjustment?
-
Where are bottlenecks forming?
-
Are we on pace to hit quarterly targets?
This is where you make tactical adjustments. If one sales rep is underperforming, you see it. If a campaign isn't generating qualified leads, you know it. You can reallocate resources or adjust strategy before the month ends.
Quarterly Review
The quarterly view is strategic. It answers: Are our objectives still realistic?
-
Do resources match priorities?
-
Which indicators predict revenue best?
-
What should leadership stop, start, or change?
This is where you make bigger decisions. Maybe your market entry strategy isn't working. Maybe your pricing needs adjustment. Maybe you need to hire more salespeople or shift budget to a different channel.
Annual Review
The annual view is reflective. It answers: What did we learn?
-
Which goals were hit?
-
Which indicators gave early warnings?
-
Which metrics need to become part of the operating rhythm?
This is where you build institutional knowledge. You document what worked, what didn't, and what you'll do differently next year.
Putting It Into Practice: Accountability and Transparency
The framework works, but execution is where most companies stumble. Here's how we implement it at Concept:
Assign ownership. Each leading indicator needs an owner. Someone responsible for tracking it, understanding it, and reporting on it. Without ownership, metrics become noise.
Use your CRM. Your CRM should be the source of truth for these metrics. If you're using Salesforce, HubSpot, or another platform, build dashboards that surface these indicators automatically. Manual spreadsheets don't scale and create room for error. For Salesforce users specifically, understanding features like Seller Home can help you leverage built-in reporting capabilities.
Make it visible. Post your leading indicators where your team sees them. A dashboard in Slack. A report in your CRM. A weekly email. Visibility creates accountability.
Review it together. Don't just track metrics in isolation. Review them as a team. Discuss what's working, what's not, and what needs to change. This is where the real learning happens.
Adjust based on what you learn. Leading indicators are only useful if you act on them. If your contact rate is dropping, figure out why and fix it. If your MQL to SQL conversion is declining, investigate. If your pipeline is aging, accelerate deals or create new ones.
Need help turning business goals into measurable action?
Defining leading indicators is one thing. Building the processes, CRM structure, dashboards, and accountability systems to track them consistently is another. Concept helps companies translate business objectives into practical operating systems by evaluating the people, processes, and technology behind the work, then creating a clear, actionable path toward the desired state.
Through our Business Process Analysis (BPA) Program, we help sales, marketing, service, and operations teams identify where workflows break down, clarify what should be measured, and determine which systems should be added, removed, integrated, or improved. The result is a practical BPA document that connects your current state, desired outcomes, and the tools needed to make progress measurable.
Ready to create business goals your team can actually execute? Start the conversation with Concept.
Partner With Concept
Share your details and our team will reach out to discuss collaboration opportunities